Unit 4 - Linear Regression with Scikit-Learn
Global Population & GDP Analysis
This tutorial demonstrates the application of linear regression analysis to investigate the relationship between a country's population and its GDP per capita. The analysis is performed using Python with libraries such as pandas, numpy, matplotlib, and scikit-learn.
Data Loading and Preprocessing
Loading and Preparing the Data
# Import required libraries
import pandas as pd
import numpy as np
import matplotlib.pyplot as plt
from sklearn.linear_model import LinearRegression
from scipy.stats import pearsonr

# Load the datasets
pop_df = pd.read_csv('Global_Population.csv')
gdp_df = pd.read_csv('Global_GDP.csv')

# Preprocess the data
years = [str(y) for y in range(2001, 2022)]
pop_df[years] = pop_df[years].apply(pd.to_numeric, errors='coerce')
gdp_df[years] = gdp_df[years].apply(pd.to_numeric, errors='coerce')

# Handle missing values
pop_df[years] = pop_df[years].apply(lambda row: row.fillna(row.mean()), axis=1)
gdp_df[years] = gdp_df[years].apply(lambda row: row.fillna(row.mean()), axis=1)

# Calculate means
pop_df['mean_population'] = pop_df[years].mean(axis=1)
gdp_df['mean_gdp'] = gdp_df[years].mean(axis=1)
Correlation Analysis
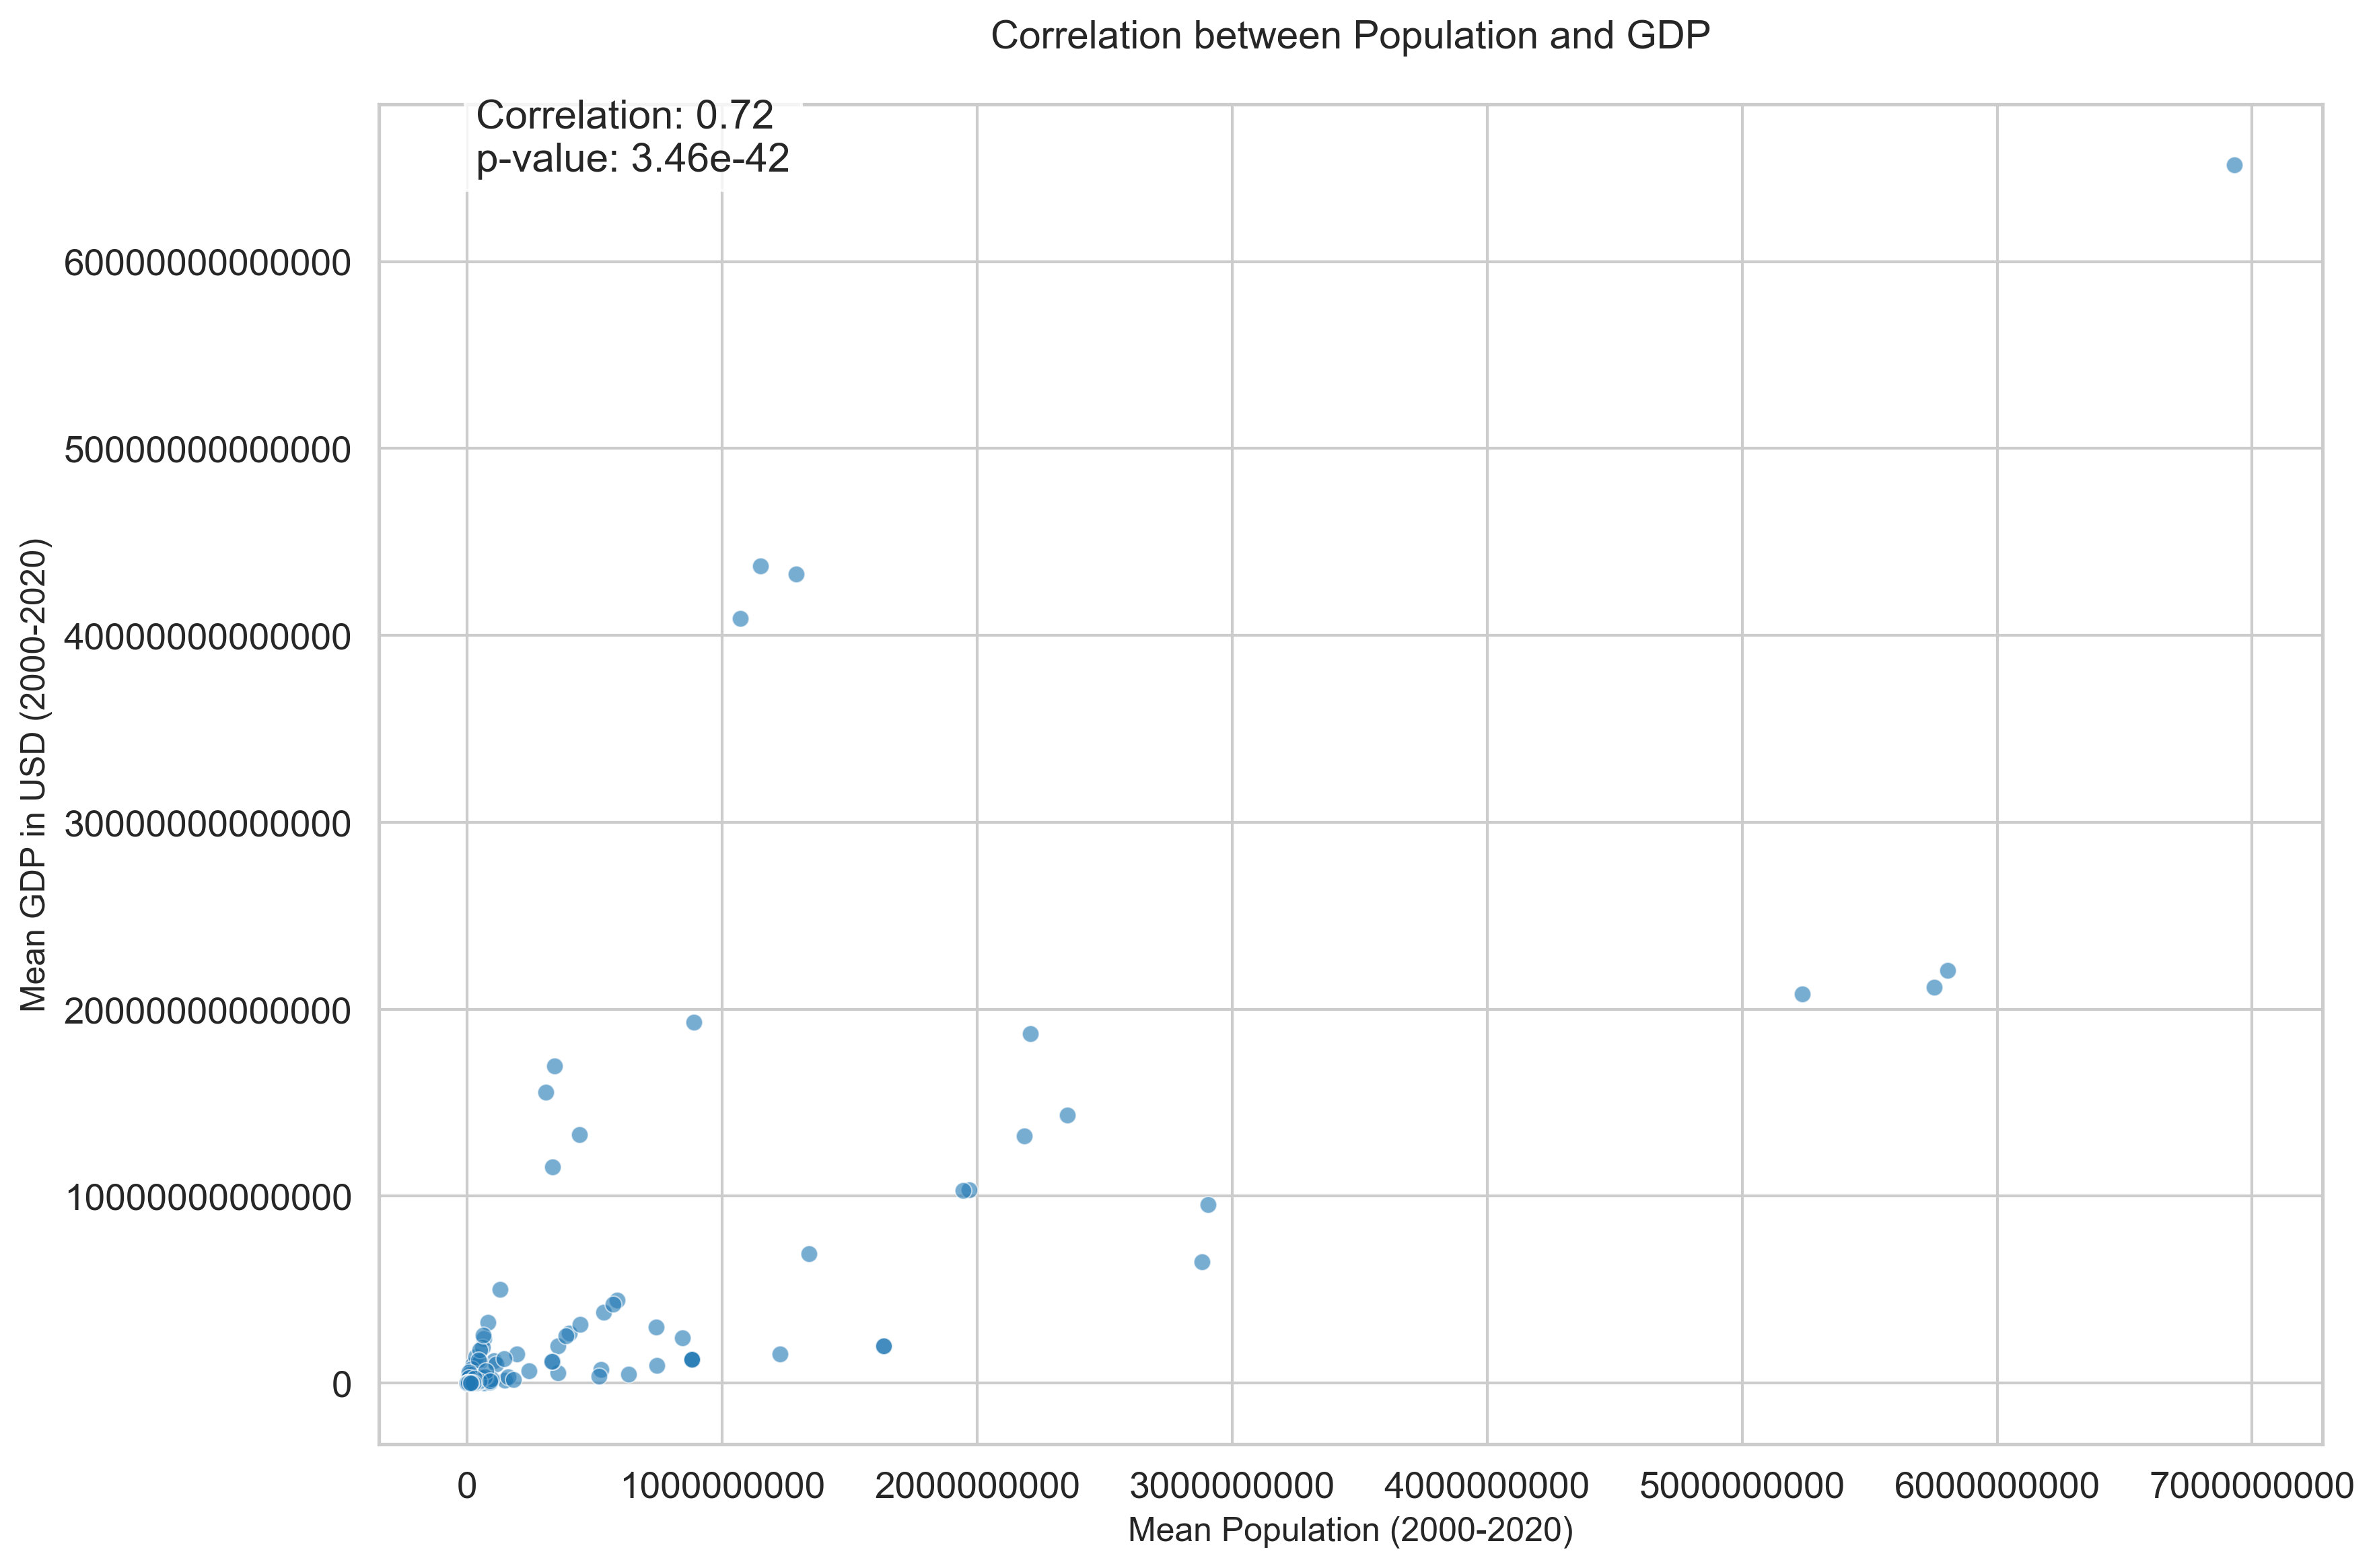 Correlation between Population and GDP per Capita
Regression Analysis
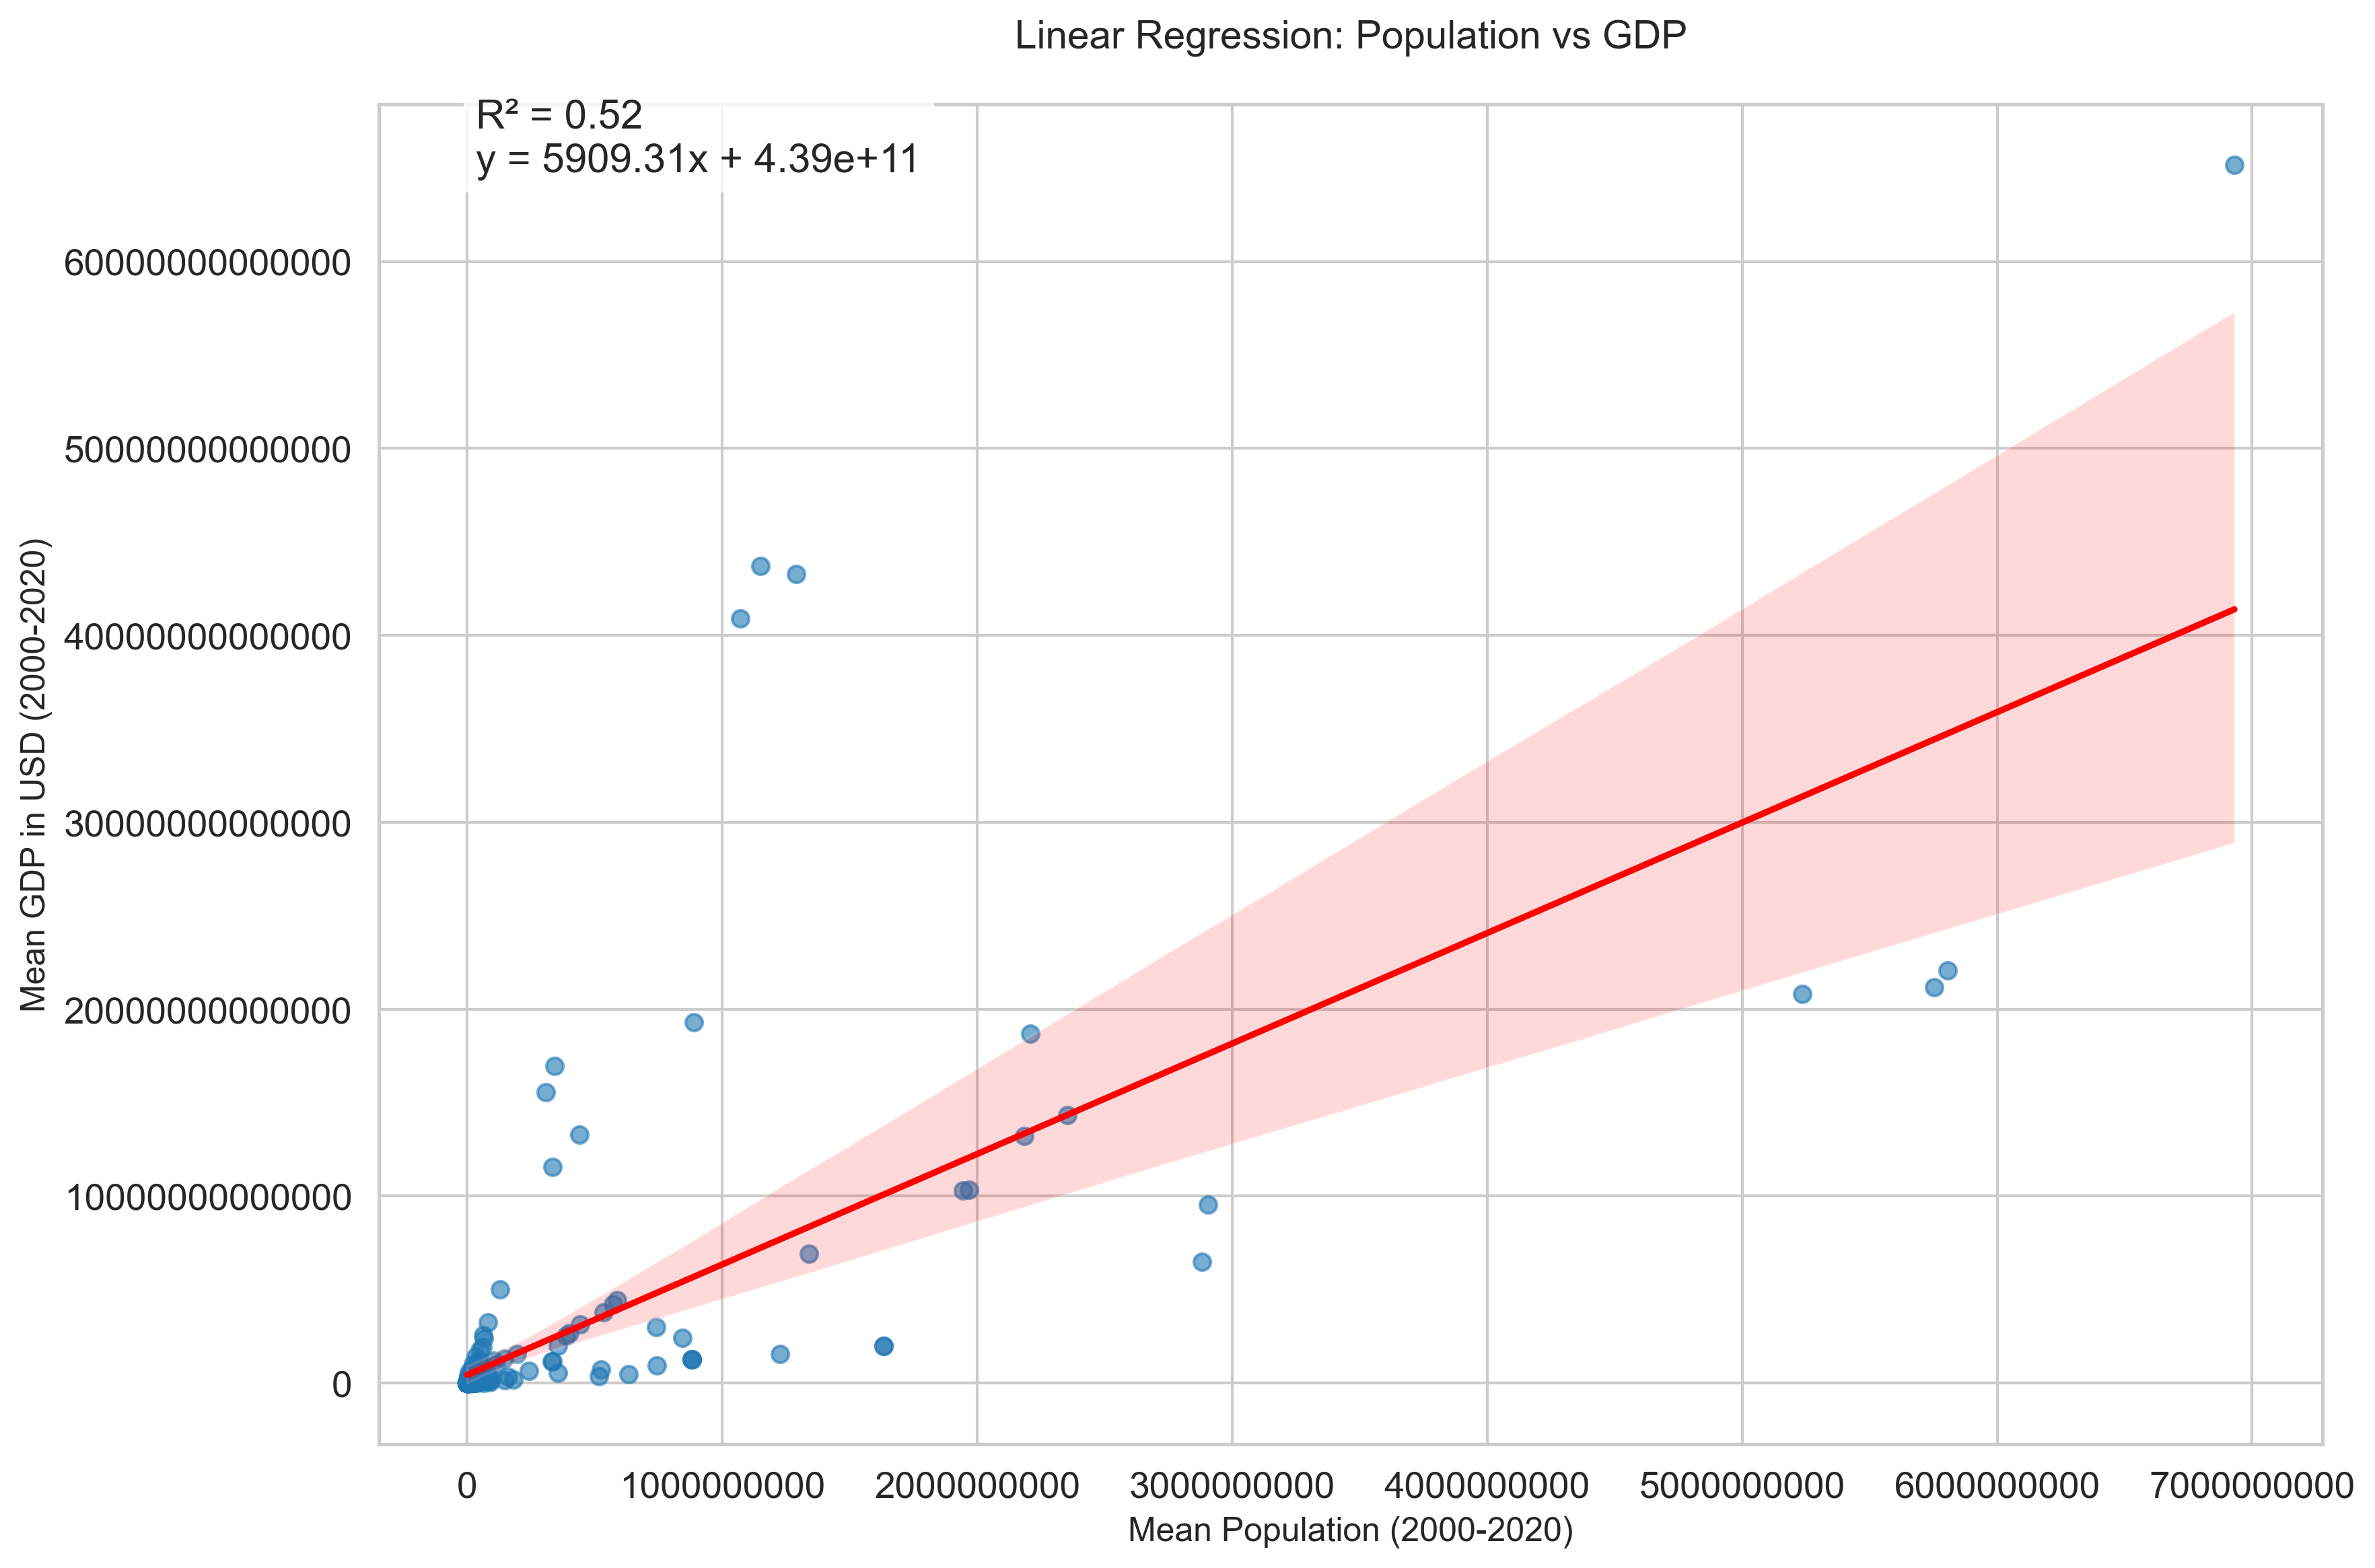 Linear Regression Analysis
Key Findings
- The analysis included data from 258 countries and regions over the period 2000-2020.
- The Pearson correlation coefficient between mean population and mean GDP is 0.72, indicating a strong positive linear relationship.
- The p-value of 3.46 × 10⁻⁴² confirms that this correlation is statistically significant.
- The regression line shows a moderate fit to the data, with an R² of 0.52, meaning that approximately 52% of the variation in mean GDP can be explained by the mean population.
- The regression coefficient is 5909.31, suggesting that for each additional person in the mean population, the mean GDP increases by approximately $5,909 USD.
- The model has an intercept of 4.39 × 10¹¹, representing the theoretical GDP when population is zero.